covariate
covariate.RmdTypes of covariates
covariates that occur at the geo_unit level
covariates that are at the exposure level
Ways to add covariates to exposure
-
you add them after either the
exposure_matrixobject is created as:- the special case of
is_us_holidaywhich has its own function - a single variable
- as another crossbasis variable
- the special case of
method 1a: included in exposure matrix creation
library(dlnm)
#> This is dlnm 2.4.10. For details: help(dlnm) and vignette('dlnmOverview').
library(gnm)
library(ggplot2)
library(data.table)

ex2 <- subset(ma_exposure, TOWN20 %in% c('BOSTON', 'CHELSEA'))

# create exposure matrix
exposure_columns <- list(
  "date" = "date",
  "exposure" = "tmax_C",
  "geo_unit" = "TOWN20",
  "geo_unit_grp" = "COUNTY20"
)

## basic
exposure_mat <-
  make_exposure_matrix(
    ex2,
    exposure_columns,
    time_subset = list(month = 5:9)
  )
#> -- NA values automatically removed
#> strata dt_by = 'day', setting strata as geo_unit:yr:mn:dow

head(exposure_mat)
#>          date TOWN20 COUNTY20  tmax_C                   strata
#>        <IDat> <char>   <char>   <num>                   <char>
#> 1: 2010-05-01 BOSTON  SUFFOLK 23.1386 BOSTON:yr2010:mn05:dow07
#> 2: 2010-05-02 BOSTON  SUFFOLK 26.1014 BOSTON:yr2010:mn05:dow01
#> 3: 2010-05-03 BOSTON  SUFFOLK 31.5648 BOSTON:yr2010:mn05:dow02
#> 4: 2010-05-04 BOSTON  SUFFOLK 27.7814 BOSTON:yr2010:mn05:dow03
#> 5: 2010-05-05 BOSTON  SUFFOLK 26.2820 BOSTON:yr2010:mn05:dow04
#> 6: 2010-05-06 BOSTON  SUFFOLK 25.8546 BOSTON:yr2010:mn05:dow05
#>         match_strata  explag1  explag2  explag3  explag4  explag5
#>               <char>    <num>    <num>    <num>    <num>    <num>
#> 1: BOSTON:2010-05-01 15.73815  8.33770 10.85230 16.44320 18.74090
#> 2: BOSTON:2010-05-02 23.13860 15.73815  8.33770 10.85230 16.44320
#> 3: BOSTON:2010-05-03 26.10140 23.13860 15.73815  8.33770 10.85230
#> 4: BOSTON:2010-05-04 31.56480 26.10140 23.13860 15.73815  8.33770
#> 5: BOSTON:2010-05-05 27.78140 31.56480 26.10140 23.13860 15.73815
#> 6: BOSTON:2010-05-06 26.28200 27.78140 31.56480 26.10140 23.13860
method 1a
set.seed(123)
rr <- sample(1:nrow(ex2), 0.01 * nrow(ex2))
ex2$randCov <- 0
ex2$randCov[rr] <- 1

covariate_columns <- list(
  "date" = "date",
  "exposure" = "randCov",
  "geo_unit" = "TOWN20",
  "geo_unit_grp" = "COUNTY20"
)

# for a single variable you can do just maxlag = 0
# and we are doing exposure is factor = T
covariate_mat <-
  make_exposure_matrix(
    ex2,
    covariate_columns,
    maxlag = 2,
    exposure_is_factor = T,
    time_subset = list(month = 5:9)
  )
#> Warning in make_exposure_matrix(ex2, covariate_columns, maxlag = 2, exposure_is_factor = T, : if exposure is a factor, the code expects it to be numeric and ordered,
#>             e.g., 1, 2, 3, ...
#> strata dt_by = 'day', setting strata as geo_unit:yr:mn:dow

head(covariate_mat)
#>          date TOWN20 COUNTY20 randCov                   strata
#>        <IDat> <char>   <char>   <num>                   <char>
#> 1: 2010-05-01 BOSTON  SUFFOLK       0 BOSTON:yr2010:mn05:dow07
#> 2: 2010-05-02 BOSTON  SUFFOLK       0 BOSTON:yr2010:mn05:dow01
#> 3: 2010-05-03 BOSTON  SUFFOLK       0 BOSTON:yr2010:mn05:dow02
#> 4: 2010-05-04 BOSTON  SUFFOLK       0 BOSTON:yr2010:mn05:dow03
#> 5: 2010-05-05 BOSTON  SUFFOLK       0 BOSTON:yr2010:mn05:dow04
#> 6: 2010-05-06 BOSTON  SUFFOLK       0 BOSTON:yr2010:mn05:dow05
#>         match_strata explag1 explag2
#>               <char>   <num>   <num>
#> 1: BOSTON:2010-05-01       0       0
#> 2: BOSTON:2010-05-02       0       0
#> 3: BOSTON:2010-05-03       0       0
#> 4: BOSTON:2010-05-04       0       0
#> 5: BOSTON:2010-05-05       0       0
#> 6: BOSTON:2010-05-06       0       0
table(covariate_mat$randCov)
#>
#>    0    1
#> 3330   36
## ok now join
exposure_mat <- join_exposure_covariate(exposure_mat, covariate_mat)
#> Warning in join_exposure_covariate(exposure_mat, covariate_mat): This could use
#> more error checking
head(exposure_mat)
#>          date TOWN20 COUNTY20  tmax_C                   strata
#>        <IDat> <char>   <char>   <num>                   <char>
#> 1: 2010-05-01 BOSTON  SUFFOLK 23.1386 BOSTON:yr2010:mn05:dow07
#> 2: 2010-05-02 BOSTON  SUFFOLK 26.1014 BOSTON:yr2010:mn05:dow01
#> 3: 2010-05-03 BOSTON  SUFFOLK 31.5648 BOSTON:yr2010:mn05:dow02
#> 4: 2010-05-04 BOSTON  SUFFOLK 27.7814 BOSTON:yr2010:mn05:dow03
#> 5: 2010-05-05 BOSTON  SUFFOLK 26.2820 BOSTON:yr2010:mn05:dow04
#> 6: 2010-05-06 BOSTON  SUFFOLK 25.8546 BOSTON:yr2010:mn05:dow05
#>         match_strata  explag1  explag2  explag3  explag4  explag5 randCov
#>               <char>    <num>    <num>    <num>    <num>    <num>   <num>
#> 1: BOSTON:2010-05-01 15.73815  8.33770 10.85230 16.44320 18.74090       0
#> 2: BOSTON:2010-05-02 23.13860 15.73815  8.33770 10.85230 16.44320       0
#> 3: BOSTON:2010-05-03 26.10140 23.13860 15.73815  8.33770 10.85230       0
#> 4: BOSTON:2010-05-04 31.56480 26.10140 23.13860 15.73815  8.33770       0
#> 5: BOSTON:2010-05-05 27.78140 31.56480 26.10140 23.13860 15.73815       0
#> 6: BOSTON:2010-05-06 26.28200 27.78140 31.56480 26.10140 23.13860       0
#>    randCovlag1 randCovlag2
#>          <num>       <num>
#> 1:           0           0
#> 2:           0           0
#> 3:           0           0
#> 4:           0           0
#> 5:           0           0
#> 6:           0           0
attributes(exposure_mat)$column_mapping
#> $date
#> [1] "date"
#>
#> $exposure
#> [1] "tmax_C"
#>
#> $geo_unit
#> [1] "TOWN20"
#>
#> $geo_unit_grp
#> [1] "COUNTY20"
#>
#> $covariate
#> [1] "randCov"     "randCovlag1" "randCovlag2"
Special case of adding US holidays
# and add holiday
exposure_mat <- add_US_holiday(exposure_mat)
head(exposure_mat)
#>          date TOWN20 COUNTY20  tmax_C                   strata
#>        <IDat> <char>   <char>   <num>                   <char>
#> 1: 2010-05-01 BOSTON  SUFFOLK 23.1386 BOSTON:yr2010:mn05:dow07
#> 2: 2010-05-02 BOSTON  SUFFOLK 26.1014 BOSTON:yr2010:mn05:dow01
#> 3: 2010-05-03 BOSTON  SUFFOLK 31.5648 BOSTON:yr2010:mn05:dow02
#> 4: 2010-05-04 BOSTON  SUFFOLK 27.7814 BOSTON:yr2010:mn05:dow03
#> 5: 2010-05-05 BOSTON  SUFFOLK 26.2820 BOSTON:yr2010:mn05:dow04
#> 6: 2010-05-06 BOSTON  SUFFOLK 25.8546 BOSTON:yr2010:mn05:dow05
#>         match_strata  explag1  explag2  explag3  explag4  explag5 randCov
#>               <char>    <num>    <num>    <num>    <num>    <num>   <num>
#> 1: BOSTON:2010-05-01 15.73815  8.33770 10.85230 16.44320 18.74090       0
#> 2: BOSTON:2010-05-02 23.13860 15.73815  8.33770 10.85230 16.44320       0
#> 3: BOSTON:2010-05-03 26.10140 23.13860 15.73815  8.33770 10.85230       0
#> 4: BOSTON:2010-05-04 31.56480 26.10140 23.13860 15.73815  8.33770       0
#> 5: BOSTON:2010-05-05 27.78140 31.56480 26.10140 23.13860 15.73815       0
#> 6: BOSTON:2010-05-06 26.28200 27.78140 31.56480 26.10140 23.13860       0
#>    randCovlag1 randCovlag2 is_holiday
#>          <num>       <num>     <lgcl>
#> 1:           0           0      FALSE
#> 2:           0           0      FALSE
#> 3:           0           0      FALSE
#> 4:           0           0      FALSE
#> 5:           0           0      FALSE
#> 6:           0           0      FALSE
attributes(exposure_mat)$column_mapping
#> $date
#> [1] "date"
#>
#> $exposure
#> [1] "tmax_C"
#>
#> $geo_unit
#> [1] "TOWN20"
#>
#> $geo_unit_grp
#> [1] "COUNTY20"
#>
#> $covariate
#> [1] "randCov"     "randCovlag1" "randCovlag2" "is_holiday"
##
outcome_columns <- list(
  "date" = "date",
  "outcome" = "daily_deaths",
  "geo_unit" = "TOWN20",
  "geo_unit_grp" = "COUNTY20"

)

boston_deaths <- subset(ma_deaths, TOWN20 %in% c('BOSTON', 'CHELSEA'))

## basic
outcomes_tbl <- make_outcome_table(
  boston_deaths,
  outcome_columns,
  time_subset = list(month = 5:9)
)
#> Missing outcome values introduced by xgrid were set to 0;
#>             assumes that every time in the dataset should have an outcome value
#> strata dt_by = 'day', setting strata as geo_unit:yr:mn:dow
#> Warning in make_outcome_table(boston_deaths, outcome_columns, time_subset = list(month = 5:9)): 2020 in data years, Outcome counts likely impacted by the
#>             COVID-19 Pandemic. Be sure to include a covariate adjustment
#>             or exclude this year from analysis.
head(outcomes_tbl)
#>          date TOWN20 COUNTY20 daily_deaths                   strata
#>        <IDat> <char>   <char>        <int>                   <char>
#> 1: 2010-05-01 BOSTON  SUFFOLK         2238 BOSTON:yr2010:mn05:dow07
#> 2: 2010-05-02 BOSTON  SUFFOLK         2089 BOSTON:yr2010:mn05:dow01
#> 3: 2010-05-03 BOSTON  SUFFOLK         2374 BOSTON:yr2010:mn05:dow02
#> 4: 2010-05-04 BOSTON  SUFFOLK         2354 BOSTON:yr2010:mn05:dow03
#> 5: 2010-05-05 BOSTON  SUFFOLK         2489 BOSTON:yr2010:mn05:dow04
#> 6: 2010-05-06 BOSTON  SUFFOLK         2191 BOSTON:yr2010:mn05:dow05
#>    strata_total      match_strata
#>           <int>            <char>
#> 1:        11312 BOSTON:2010-05-01
#> 2:        10929 BOSTON:2010-05-02
#> 3:        11435 BOSTON:2010-05-03
#> 4:         9372 BOSTON:2010-05-04
#> 5:         9193 BOSTON:2010-05-05
#> 6:         8657 BOSTON:2010-05-06
m1 <- condPois_1stage(exposure_mat,
                      outcomes_tbl,
                      multi_zone = T,
                      global_cen = 25)
#>
#> crossbasis args for geo_unit  BOSTON,CHELSEA :
#>
#> maxlag: 5
#>
#> argvar:
#> List of 2
#>  $ fun  : chr "ns"
#>  $ knots: Named num [1:2] 26.2 31.7
#>   ..- attr(*, "names")= chr [1:2] "50%" "90%"
#>
#> arglag:
#> List of 2
#>  $ fun  : chr "ns"
#>  $ knots: num [1:2] 0.878 2.095
#>
#> strata:
#> BOSTON:yr2010:mn05:dow07
#> strata_min: 0
#>
#> min_n: 50
#>
#> truncate final RR and basis cen:  0.025
#> formula:
#>    daily_deaths ~ cb + randCov + randCovlag1 + randCovlag2 + is_holiday
#> family: quasipoisson

plot(m1)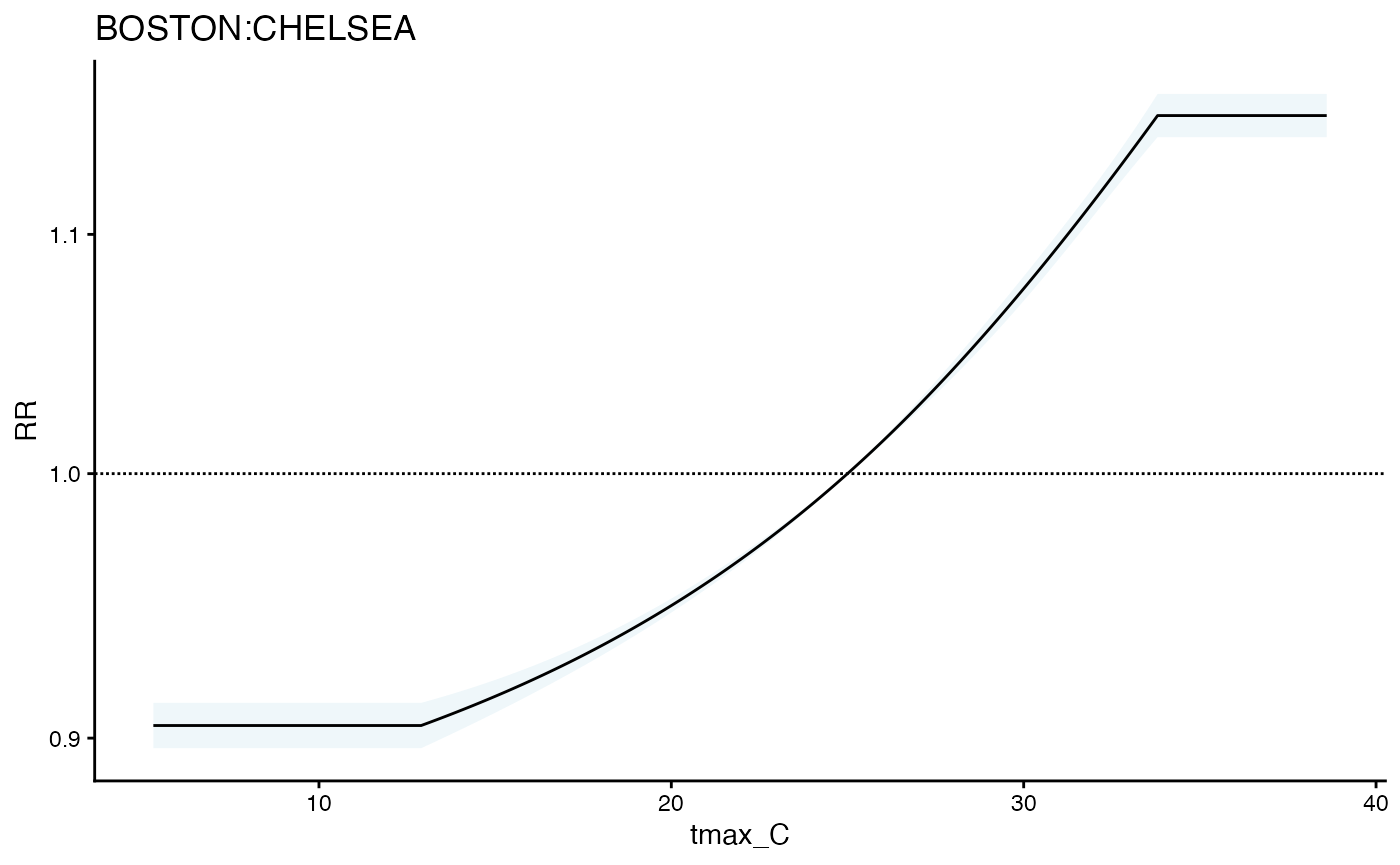
method 2b: included as a single variable
to do this just change maxlag = 0 in the step above
# for a single variable you can do just maxlag = 0
# and we are doing exposure is factor = T
covariate_mat <-
  make_exposure_matrix(
    ex2,
    covariate_columns,
    maxlag = 0,
    exposure_is_factor = T,
    time_subset = list(month = 5:9)
  )
#> Warning in make_exposure_matrix(ex2, covariate_columns, maxlag = 0, exposure_is_factor = T, : if exposure is a factor, the code expects it to be numeric and ordered,
#>             e.g., 1, 2, 3, ...
#> strata dt_by = 'day', setting strata as geo_unit:yr:mn:dow