Plot method for condPois_2stage
plot.condPois_2stage.RdPlot method for condPois_2stage
Usage
# S3 method for class 'condPois_2stage'
plot(x, geo_unit, xlab = NULL, ylab = NULL, title = NULL, ...)Examples
towns <- c("CHELSEA", "EVERETT", "REVERE", "MALDEN")
exposure_columns <- list("date" = "date", "exposure" = "tmax_C",
                         "geo_unit" = "TOWN20", "geo_unit_grp" = "COUNTY20")
outcome_columns <- list("date" = "date", "outcome" = "daily_deaths",
                        "geo_unit" = "TOWN20", "geo_unit_grp" = "COUNTY20")
time_subset <- list(month = 5:9, year = 2012:2013)
exposure_mat <- make_exposure_matrix(subset(ma_exposure, TOWN20 %in% towns),
                                     exposure_columns, time_subset = time_subset)
#> -- NA values automatically removed
#> strata dt_by = 'day', setting strata as geo_unit:yr:mn:dow
outcomes_tbl <- make_outcome_table(subset(ma_deaths, TOWN20 %in% towns),
                                   outcome_columns, time_subset = time_subset)
#> Missing outcome values introduced by xgrid were set to 0;
#>             assumes that every time in the dataset should have an outcome value
#> strata dt_by = 'day', setting strata as geo_unit:yr:mn:dow
m <- condPois_2stage(exposure_mat, outcomes_tbl, global_cen = 20)
#>
#> crossbasis args for geo_unit  CHELSEA :
#>
#> maxlag: 5
#>
#> argvar:
#> List of 2
#>  $ fun  : chr "ns"
#>  $ knots: Named num [1:2] 25.6 32.1
#>   ..- attr(*, "names")= chr [1:2] "50%" "90%"
#>
#> arglag:
#> List of 2
#>  $ fun  : chr "ns"
#>  $ knots: num [1:2] 0.878 2.095
#>
#> strata:
#> CHELSEA:yr2012:mn05:dow03
#> strata_min: 0
#>
#> min_n: 50
#>
#> truncate final RR and basis cen:  0
#> formula:
#>    daily_deaths ~ cb
#> family: quasipoisson
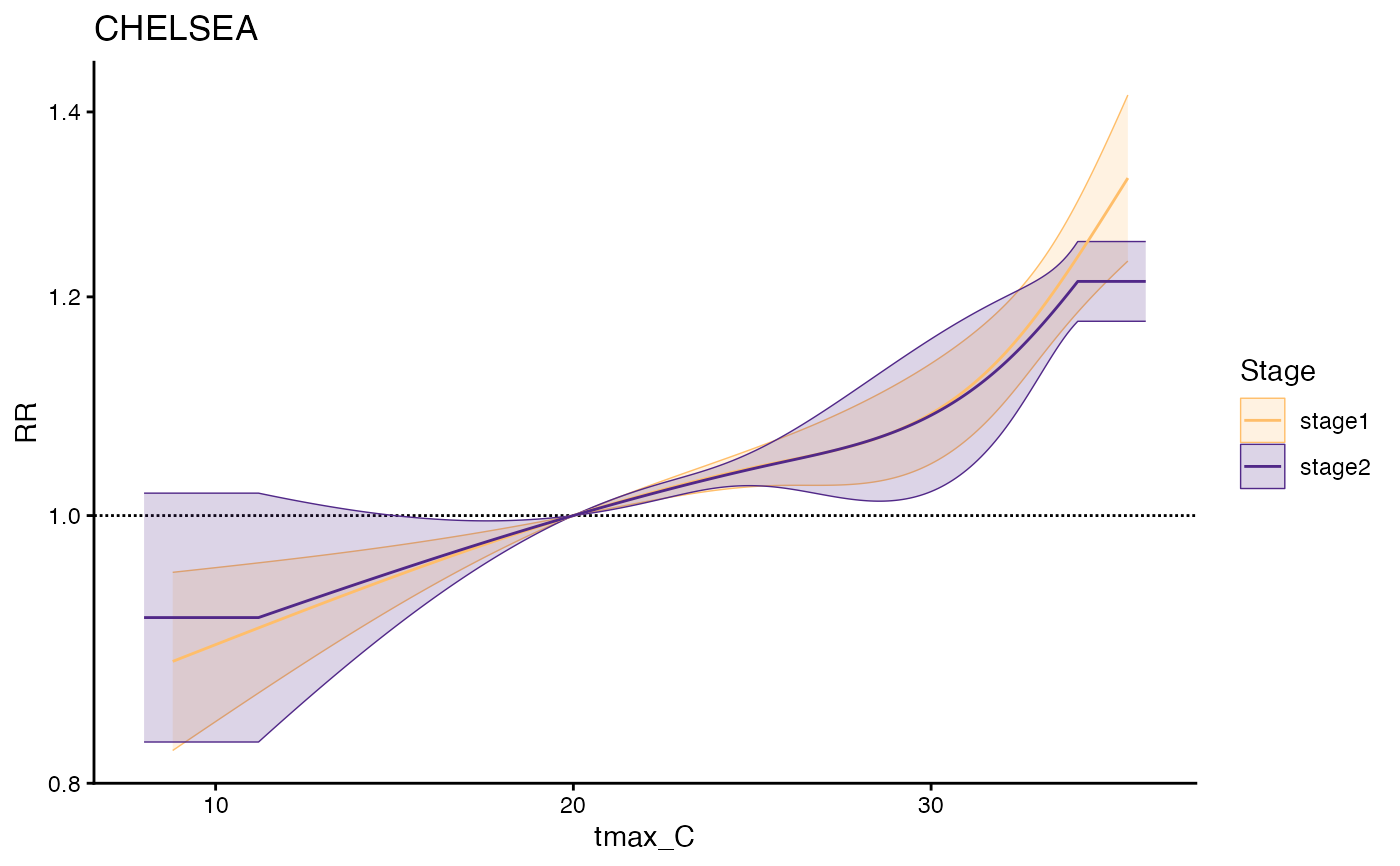
plot(m, geo_unit = "CHELSEA")